
Average Directional Movement (ADX) and DMI
DMI consists of three fundamental elements:
1) ADX: this is the main variable, the one already operating in the initial version of the indicator. Its purpose is to provide information on the strength of the trend, or on its weakness, if it returns very low values.
2) -DI: this variable is activated, at least predominantly, when the market moves, perhaps in a not fully visible way, according to a bearish trend.
3) +DI: this variable is activated, however, when exactly the opposite happens, that is, when the market, however weak it may be, moves according to a bullish trend.
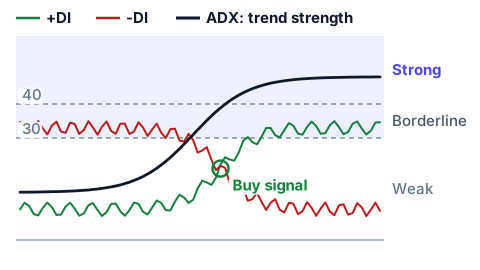
The expressed value of the ADX moves in a range from 0 to 100.
Zero represents the maximum possible weakness of the trend, 100 represents the maximum possible strength. Obviously these are extreme values, which have very rarely occurred throughout history.
In any case, an ADX below 30 indicates a weak trend; an ADX between 30 and 40 indicates a borderline trend, between weak and consolidated; while an ADX above 40 indicates a strong trend.
The same goes for the -DI and the +D. The range is 0-100, values close to zero indicate weak trends for the +DI and strong for the -D. Vice versa, values close to 100 indicate weak trends for the -DI and strong for the +D.
The -DI and +Di values should always be consulted, but in relation to the same ADX. This is where the graphic representation comes into play, which takes on the connotations of technical and interpretative elements.
+DM (plus directional movement) and -DM (minus directional movement) are determined by the difference between two consecutive minimums and the difference of the two relative maximums.
Generally, it is assumed that the trend is positive when the +DI is higher than the -DI and vice versa for the negative trend.
ADX is able to provide indications about buying signals. Specifically, it might be a good idea to open a long position when the ADX expresses a value higher than 30 (growing) and when the +DI line crosses the -DI line from bottom to top. This means that a strong trend is about to begin, as the ADX value is discrete and growing.
The speech is similar, for potential sell signals: it is good that the ADX always expresses values above 30, but in this case the other two lines reverse roles. In fact, it is the -DI line that surpasses the +DI line from bottom to top. This is a clear signal of a bearish trend, which calls the trader to the possibility of selling, therefore of opening a Short position.