
Beta (Raw, Adjusted, Bull/Bear)
Beta measures an asset's volatility in relation to the overall market benchmark. A Beta of 1.0 indicates that the asset's price moves in lockstep with the market. A Beta greater than 1.0 suggests the asset is more volatile than the market (aggressive), while a Beta less than 1.0 indicates it is less volatile (defensive). Beta is calculated by comparing the historical returns of the asset against the returns of the benchmark, to find the statistical relationship between the two.
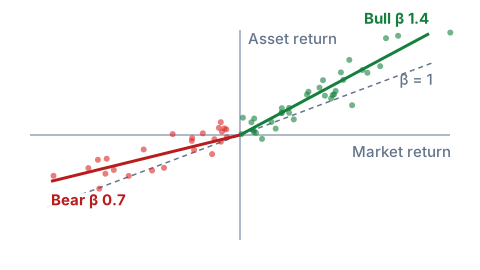
We distinguish between several types of Beta analytics:
1. Raw Beta: The pure historical relationship observed in past data. 2. Adjusted Beta: A statistical correction that pulls the historical Beta toward the market average of 1.0. This accounts for the real-world tendency of extreme volatilities to stabilize over time. 3. R-Squared: This companion metric acts as a confidence score, telling you what percentage of the asset’s movements are actually explained by the benchmark versus unique internal factors.
Advanced analysis involves Asymmetric Beta: Bull Beta measures sensitivity specifically during market upturns. A high Bull Beta is desirable for capturing gains during rallies. Bear Beta measures sensitivity specifically during market downturns. A low Bear Beta is critical for capital protection, as it indicates the asset drops less than the market during crashes.
Understanding this duality helps investors choose assets that capture the upside while dampening the downside.