
Bollinger Bands
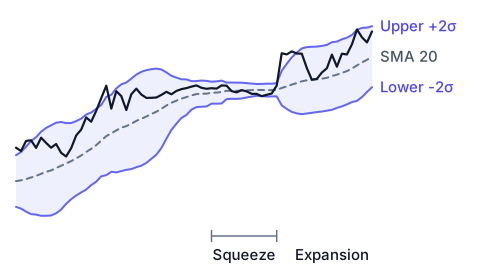
It is an indicator formed by three distinct lines on the chart that indicate price ranges:
the central line represents the moving average of the price (by default the 20-period simple moving average is used).
the upper band is calculated by adding 2 standard deviations of the price to the value of the moving average.
The lower band is calculated by subtracting 2 standard deviations of the price from the value of the moving average.
Bollinger Bands perform two functions:
the first is to signal the phases of volatility in the most immediate way possible: the upper and lower bands measure the dispersion of the price around the moving average and the volatility.
The second consists in the representation of dynamic pivot points, that is, a resistance line and a support line that follow the price and the events that occur in real time: the upper and lower bands form a price range (the envelopes) that enclose, in most cases, the market movements (maximum and minimum values). The closer or narrower the bands are to each other, the lower the price volatility. For technical analysts, the contraction of the bands represents a period of consolidation or market settlement. The further the bands are from each other, the greater the price volatility. When expanding, the bands often indicate the start of a new price trend.
When the bands are contracted, the upper band often represents resistance, while the lower band represents support. If the price were to break through the resistance or fall below the support, new trading opportunities could arise for investors.
The three lines are expressed in the price of the security itself, so they cannot be compared between two different securities: a distance of 4 dollars from the moving average means one thing on a stock trading at 20 dollars and another on one trading at 400. The normalized reading solves this. It states where the price sits between the two bands as a single number, using the formula (price - lower band) / (upper band - lower band). A value of 0 means the price is exactly on the lower band, 1 means it is on the upper band, and 0.5 means it is on the moving average. Values above 1 or below 0 mean the price has closed outside the envelope. Because the number no longer carries a currency or a scale, two securities can be ranked side by side on how stretched they are relative to their own recent volatility.