
Buffett Indicator
The Buffett Indicator (also known as Buffett Index or Buffett Ratio) represents the ratio of the total United States stock market capitalization to GDP. This fundamental valuation metric compares the aggregate value of all publicly traded companies to the size of the underlying economy. The indicator fluctuates over time as stock market values can be highly volatile, while GDP tends to grow more predictably. When the stock market value grows significantly faster than the actual economy, it may signal a potential bubble. The most common measurement uses the Wilshire 5000 index, which captures the total market capitalization of all US publicly traded companies and serves as the benchmark for the entire American stock market.
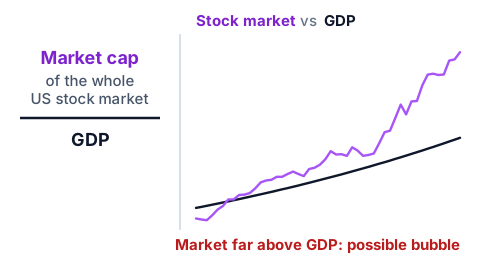
The Wilshire 5000 provides the primary data source for calculating the Buffett Indicator, with monthly data available from 1971 and daily measurements beginning in 1980. Originally designed so that a 1-point increase corresponded to a $1 billion increase in US market capitalization, this ratio has slightly drifted over time. As of 2020, a 1-point increase in the index corresponded to approximately $1.05 billion in market cap. GDP (Gross Domestic Product) represents the total annual production of the US economy, measured quarterly by the Bureau of Economic Analysis. GDP serves as a static measurement of prior economic activity and does not forecast future performance or include expectations of future economic growth, making it a backward-looking fundamental anchor for the comparison.
The Buffett Indicator has important limitations that investors must consider. It only examines stock market valuations in isolation and does not account for how equities are valued relative to alternative investments, particularly bonds. Interest rate environments significantly impact stock valuations independent of GDP growth. When interest rates are high, bonds offer attractive returns, reducing demand for stocks and lowering equity prices. Higher rates also increase borrowing costs for businesses, reducing corporate profits and stock values. Conversely, low interest rates make bonds less attractive, increasing demand for stocks while reducing corporate borrowing costs and boosting profits. These interest rate dynamics can cause the Buffett Indicator to appear elevated or depressed based on monetary policy rather than fundamental economic conditions.
Practical application of the Buffett Indicator requires understanding its historical context and current limitations. While Warren Buffett has referenced this metric as a useful valuation tool, it should be combined with other indicators for complete market analysis. The ratio can remain elevated for extended periods during low interest rate environments or technological transformation periods. Investors should consider the indicator alongside earnings multiples, interest rate levels, inflation expectations, and global economic conditions. Historical analysis shows the indicator can provide valuable insights into long-term market valuations, but it should not be used as a timing tool for short-term investment decisions. The metric works best as part of a broader valuation framework for assessing overall market attractiveness.