
Chaikin Money Flow (CMF)
The CMF is an indicator created by Marc Chaikin that compares buying pressure with selling pressure, revealing the interest of buyers and sellers for a security. It shows phases of accumulation and distribution, confirming the strength of a trend or signaling possible reversals.
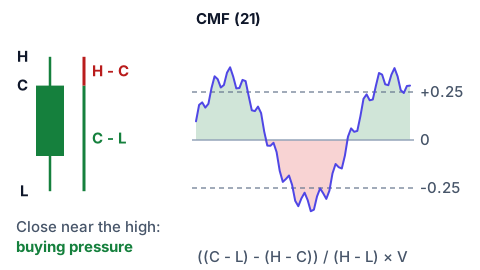
Formula: the money flow volume of a single period is ((( C-L ) - ( H-C )) / ( H-L )) * V, and the CMF is the sum of those values over n periods (21 by default) divided by the sum of the volume over the same periods.
Where: C = closing price, L = lowest price, H = highest price, V = volume. The result oscillates between -1 and +1. Interpretation: Positive CMF: greater buying pressure. Negative CMF: greater selling pressure.
It can be used by looking for divergences between CMF and price.
Bullish divergence: CMF marks new highs while price marks new lows. Bearish divergence: CMF marks new lows while price marks new highs.
Or it can be used by looking for peaks and depressions:
Readings above +0.25: money flowing in at an extreme rate, possible bullish excess. Readings below -0.25: money flowing out at an extreme rate, possible bearish excess. Values close to zero mean that buying and selling pressure are balanced.