
Correlation
Correlation measures the statistic relationship between two assets, indicating whether and how much they tend to vary together.
Correlation is expressed in statistics by the Pearson correlation coefficient (for numerical and linear variables), which takes values between -1 and 1.
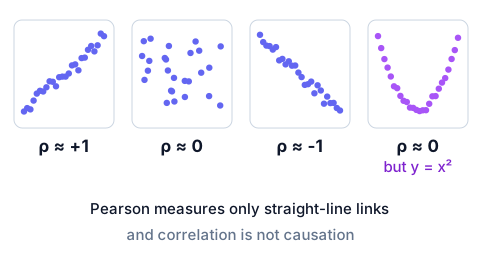
+1: perfectly positive correlation (when one variable increases, the other variable also increases proportionally).
-1: perfectly negative correlation (when one variable increases, the other decreases proportionally).
0: no linear correlation (the variables show no direct relationship).
A high correlation indicates that there is a common trend between the variables, but it does not imply causality: knowing that two variables are correlated does not mean that one causes the other.
The word linear in that definition carries more weight than its position suggests. Pearson measures how closely two series follow a straight line, and nothing beyond that: two variables can be tied together perfectly and still return a coefficient of zero, whenever the shape that ties them bends. A series and its own square do exactly this over a symmetric range, because the left half falls while the right half rises and the two cancel out. A reading near zero therefore rules out a straight line and rules out nothing else, so it is not a statement that the two variables are unrelated. The opposite reading deserves the same caution: two prices can rise together for years, correlate at almost one, and still drift apart for good, because correlation says nothing about whether the distance between them stays stable. That is a separate question with a separate test, and it has its own card, cointegration.
A correlation computed once over the whole history is a single number, and a single number cannot say whether the relationship held all along or only in part of the period. Rolling correlation answers that second question. It is the same coefficient, computed again and again on a window of fixed length that slides forward one observation at a time: each point of the resulting curve is the correlation measured on the window of data that ends on that date.
Read over months and years, the curve shows whether a relationship is steady, whether it appears only in certain market phases (for instance during sell-offs, when many assets tend to fall together), whether it has been weakening, and whether it changes sign when the market changes regime. That is what it is for: judging how far a relationship measured on the past can be trusted, instead of taking one number for granted.
Three cautions decide how the curve should be read. The first is that the correlation over the whole history is not the average of the rolling curve, and the two can even carry opposite signs. Each window removes its own mean and looks only at how the two series move together inside it, while the full period figure also counts what happens between distant periods, such as years in which both series sat high and years in which both sat low. They answer two different questions, and neither answer is the wrong one.
The second is that a short window is noisy. With few observations, two series with no relationship at all still produce a curve that swings well away from zero, and the swings can look dramatic. It is noisier still when one series is a return over a future horizon, because neighbouring days share most of that future and the window holds fewer independent observations than it seems. A curve therefore means little without a reference for what chance produces on the same data: one way is to break the link on purpose, for example by shifting one series by a long stretch of time, and look at the range the rolling correlation still reaches. A curve that stays inside that range most of the time is not evidence of a relationship, and a sign that holds year after year says more than any single peak.
The third is that a correlation with future returns cannot reach today. The point for a given date needs the prices of the days that follow it, up to the chosen horizon, so the last measurable point sits that far behind the latest price. A curve of this kind describes how a relationship behaved in the past, and it is not a live reading of what is happening now.