
Cycle Analysis
Cycle Analysis is a method used to identify recurring patterns in financial markets. It's based on the premise that market movements follow repetitive cycles over time. These cycles can be of varying lengths, from intraday to multi-year cycles, and are influenced by various factors including economic conditions, investor psychology, and seasonal patterns. By identifying these cyclical patterns, traders aim to predict future market movements and make more informed trading decisions.
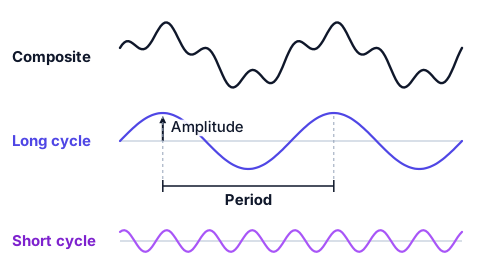
There are several approaches to cycle analysis. The Fourier Analysis decomposes price data into component sine waves of different frequencies to identify dominant cycles. Hurst Cycles focus on the concept that market movements follow natural cycles in specific time frames. The concept of harmonics in cycle analysis suggests that smaller cycles are often found within larger ones, creating a fractal-like structure of market movements. Traders often use cycle analysis alongside other technical indicators for confirmation, as cycles can shift or change in response to market conditions.
To implement cycle analysis, traders typically start by identifying potential cycles using visual inspection or algorithmic methods. Once a cycle is identified, its period (length) and amplitude (height) are measured. Future price projections can then be made based on the assumption that the cycle will continue. It is important to note that cycles rarely repeat exactly the same way each time, so traders must account for variations in timing and magnitude. Additionally, cycle analysis works best in trending or range-bound markets and may be less effective during significant market transitions or highly volatile periods.
One caution belongs before all of the above, and it is stronger than the reminder that cycles shift. A series with no cycle in it at all still produces one when you go looking. Take a pure random walk, a price that moves by accumulating unrelated daily changes and nothing more, and fit the best cycle you can to it: the method hands back a period and a share of the movement explained, and both figures can look as convincing as the ones a genuine cycle produces. The method has no way of reporting that it found nothing, because it was never built to answer that question. A dominant cycle found in past data is therefore a hypothesis rather than a discovery, and it earns its place only if it survives on the sessions that came after the ones it was fitted to.