
Fibonacci Analysis
Fibonacci analysis, named after the famous Italian mathematician Leonardo da Pisa, known as Fibonacci, are based on a unique numerical sequence where each number is the sum of the two preceding ones (1, 1, 2, 3, 5, 8...), finding applications across various aspects of nature and the universe.
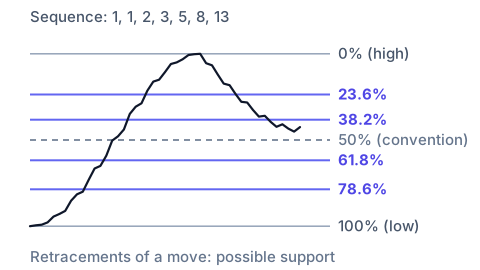
In trading, Fibonacci levels are employed to identify potential support and resistance points on financial asset price charts. The primary Fibonacci-derived tools used in trading are three: retracements, extensions, and fans.
1) Fibonacci retracements help traders identify potential support or resistance levels. These levels are calculated after a market has made a significant move up or down and appears to be correcting that movement.
2) Fibonacci extensions are used to determine how far the next price movement might continue after a correction.
3) Lastly, Fibonacci fans provide angular guidelines based on the sequence that help predict future support or resistance areas.
Two cautions belong with these tools. The first concerns the levels themselves: 50% is drawn on almost every chart alongside 38.2% and 61.8%, and it does not come from the sequence at all. It is simply half of the move, kept by convention because everyone draws it. The ratios that do come from the sequence are 23.6%, 38.2%, 61.8% and 78.6%, the last being the square root of 61.8%. The second concerns what happens at a level. Whether one held is something you measure afterwards, by counting how often price turned there against how often it went straight through, and on any single move several levels sit close enough together that at least one of them will land near the turn. A level named as support only once the price has bounced is not a prediction, it is a description with a date on it.