
Financial Ratios
The Return on Equity (ROE), defined as Net Income / Shareholders Equity, reflects the yield obtained on the capital invested by the owners.
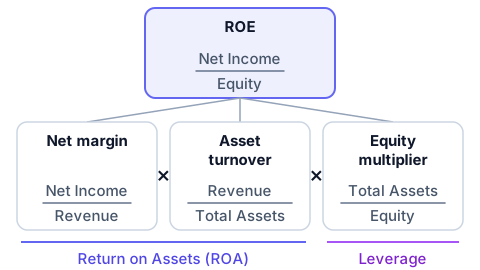
ROE on its own does not say where the return came from. The DuPont decomposition splits it into three factors that multiply together: net margin (Net Income / Revenue), asset turnover (Revenue / Total Assets) and the equity multiplier (Total Assets / Shareholders Equity). The first two combine into Return on Assets (ROA), which measures how much profit the business squeezes out of the resources it employs; the third is leverage, and it is simply the mirror of the Debt to Equity ratio described below. The consequence is worth stating plainly: at unchanged operating profitability, ROE rises with leverage. Two companies reporting the same ROE can therefore be very different businesses, one earning it and the other borrowing it, and the ratio that tells them apart is ROA.
Liquidity ratios like the Current Ratio (Current Assets / Current Liabilities) evaluate the firm's ability to settle short-term obligations within twelve months.
Leverage and Solvency ratios jointly assess a company's long-term financial stability by linking capital structure with the sustainability of debt obligations. The Debt to Equity ratio (Total Debt / Shareholders’ Equity) measures the extent to which a firm relies on debt financing relative to equity, highlighting the degree of financial leverage. The Equity Ratio (Shareholders’ Equity / Total Assets) complements this view by indicating the proportion of assets financed by owners and the firm’s financial independence. Solvency is further evaluated through debt servicing capacity, captured by the Interest Coverage Ratio (EBIT / Interest Expense), which shows how many times operating earnings can cover interest costs, making leverage sustainable only when supported by adequate operating profitability.
Modern leverage analysis includes Lease Liabilities, which under IFRS 16/ASC 842 must be recognized on the balance sheet, potentially impacting debt-to-equity and ROA.
Net Debt (Total Debt - Cash) and the Net Debt/EBITDA ratio are crucial for understanding the actual debt burden and repayment capacity
Cash Flow metrics provide a transparent view of financial health beyond accounting profits. Cash From Operations (CFO) reflects the liquidity generated by core business activities.
Free Cash Flow (FCF), calculated as CFO - CapEx, represents one of the most informative measures of financial performance.
Free Cash Flow to the Firm (FCFF) is a hypothetical figure used in valuations to estimate cash available to all stakeholders regardless of debt levels.
Asset Quality metrics focus on the nature and recoverability of a company resources. The Goodwill Ratio (Goodwill / Total Assets) and Intangible Ratio (Intangible Assets / Total Assets) measure reliance on non-physical assets, which can represent the majority of firm value in tech-intensive sectors.
Tangible Common Equity (TCE), calculated as Shareholders Equity - Intangibles - Goodwill - Preferred Stock, measures the true equity strength available to absorb losses in liquidation scenarios, making it a vital metric for bank stress testing.