
Ichimoku Kinko Hyo (IKH)
Invented by Japanese journalist Goichi Hosada in 1969, the IKH shows price trend levels and support and resistance areas in an innovative way, using various moving averages:
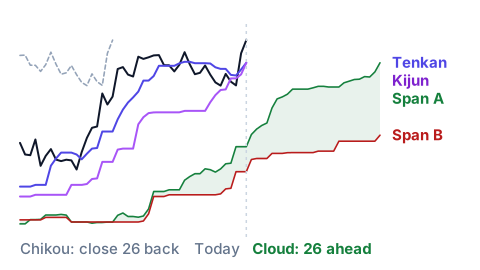
The indicator is made of five lines.
Tenkan Sen: average between the highest high and the lowest low of the last 9 periods.
Kijun Sen: average between the highest high and the lowest low of the last 26 periods.
Senkou Span A: average between Tenkan Sen and Kijun Sen, projected forward by 26 periods.
Senkou Span B: average between the highest high and the lowest low of the last 52 periods, projected forward by 26 periods.
Chikou Span: the current closing price, plotted backwards by 26 periods.
The area between Senkou Span A and Senkou Span B forms the cloud (Kumo), and it is the zone read as support when the price stays above it and as resistance when the price stays below.
Ichimoku is a powerful tool for identifying past trends and help to see future trends, but it is effective only when the market shows a clear direction. In sideways market situations, its effectiveness decreases significantly.