
The Jarque-Bera test
It is a statistical test used to test whether a sample of data comes from a normal distribution. It is based on the measure of skewness and kurtosis of the distribution.
How to Interpret It?
Null Hypothesis (H0): the data comes from a normal distribution.
The test calculates a test statistic (JB) that measures how much the measures of skewness and kurtosis of the data deviate from the expected values for a normal distribution (skewness = 0, kurtosis = 3).
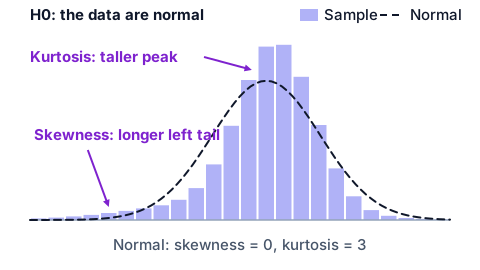
Let's take an example: imagine testing whether the daily returns of a stock are normally distributed. You collect the closing prices of the last two years, turn them into daily returns and compute the skewness and the kurtosis of that sample. Fat tails and an asymmetric distribution both push the JB statistic up, and the test says whether that deviation is large enough to be more than sampling noise.
The p-value associated with the JB statistic indicates the probability of obtaining a value of JB at least as large as the observed one, assuming that the null hypothesis is true.
If p-value < α (significance level, typically 0.05): the null hypothesis is rejected, concluding that the data does not follow a normal distribution.
If p-value ≥ α: there is not enough evidence to reject the null hypothesis.