
The Kolmogorov-Smirnov test
It is a statistical test used to test whether a sample of data comes from a particular theoretical distribution (such as the normal). In essence, it compares the empirical cumulative distribution function of the data with the expected theoretical one.
How to Interpret It?
Null Hypothesis (H0): the distribution of the data follows the specified theoretical distribution (or the two distributions are the same).
Alternative Hypothesis (H1): the distribution of the data does not follow the specified theoretical distribution (or the two distributions are different).
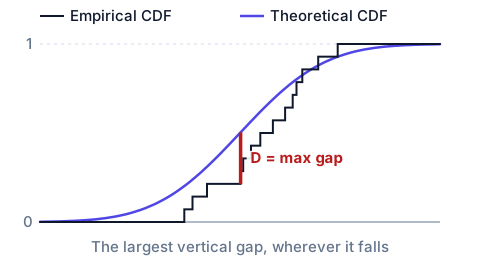
The test calculates a test statistic (D) that measures the maximum vertical distance between the two cumulative distribution functions. The greater this distance, the less likely it is that the data comes from the specified theoretical distribution.
The p-value associated with the D statistic indicates the probability of obtaining a value of D at least as large as the observed one, assuming that the null hypothesis is true.
If p-value < α (significance level, typically 0.05): the null hypothesis is rejected, concluding that the data do not come from the specified theoretical distribution (or that the two distributions are different).
If p-value ≥ α: there is insufficient evidence to reject the null hypothesis.
One detail decides when this test can be trusted, and it is inside the definition of D itself. D is a maximum, and the largest vertical gap between two cumulative curves almost always falls near the centre of the distribution, where observations are dense and the empirical curve rises steeply. Out in the tails that curve advances in tiny steps, one observation at a time, so even a large proportional error out there moves D very little. The practical consequence is that a sample whose tails are badly wrong can still produce a small D and a comfortable p-value. Where the tails are the part that matters, and in finance they usually are, a test that weights them on purpose, such as Anderson-Darling, will disagree with this one. That is not the two tests contradicting each other: they are measuring different things, and the disagreement itself is the information.