
Moving Average Convergence Divergence (MACD)
It is an oscillator with a complex construction, but which has the advantage of limiting the subjectivity of the analyst in his study.
MACD essentially serves two purposes:
1) The first is to reveal and analyze the momentum, or the degree of strength of the market.
2) The second purpose, instead, is to give a clear idea of what the current trend is.
Two apparently very different purposes, but which together offer indications on the path to take.
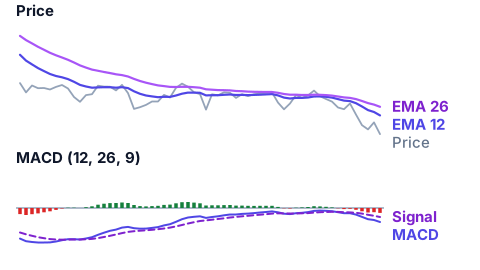
The building blocks of the MACD are moving averages.
It is calculated by subtracting the value of a 26-period exponential moving average (EMA) from a 12-period exponential moving average (EMA). This data processing gives rise to an oscillator that is used by combining it with its own 9-period exponential moving average.
The three components of the MACD plot:
1) MACD Line: this line, which appears on the chart (usually at the bottom) is the result of the subtraction between a long-term EMA (exponential moving average) and a shorter-term EMA. Generally, as already mentioned, the 26-period + 12-period scheme is chosen.
2) Signal Line: this is a particular line, which should represent the "present", or at least a concept as similar as possible. It is the result of a very fast exponential moving average, with 9 periods. Some, however, choose to reduce the number of periods even further.
3) MACD Histogram: this is a real histogram, or a graphic representation, session after session, of the difference between the MACD line and the signal line. This difference oscillates around the value of zero.
Buy signals are generated when the MACD breaks through its moving average from below. vice versa, sell signals are generated when the MACD breaks through its moving average downwards. MACD can give interesting suggestions especially during a market with a defined trend; sometimes it creates false signals in markets that move sideways.
The weak point of the MACD is that, on average, it's not very reactive in phases of extreme volatility.
For this reason, to realize the state of the market from the point of view of volatility, it's good to associate it with other indicators, such as for example the ADX.