
Money Flow Index (MFI)
It is a type of technical oscillator that uses price and volume data simultaneously to determine, like RSI, whether an asset is overbought or oversold.
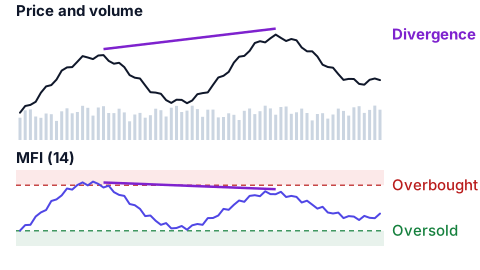
Another use of this technique is to detect divergences, which indicate a change in price trend. The oscillator fluctuates within a range of 0 to 100.
This is the formula: MFI = 100 - (100 / 1 + Money Flow Ratio).
Money Flow Ratio = (Positive Money Flow of the period) / (Negative Money Flow of the period).
Money Flow = Typical Price for last 14 periods * Volume.
Money Flow is positive or negative comparing the Typical Price for period "n" with that of the previous day (Typical Price "n-1").
Typical price = (highest price + lowest price + closing price) / 3.
An MFI reading above 80 is considered overbought, while an MFI reading below 20 is considered oversold. Its important to note a divergence between the indicator and the price.
For example, if the indicator increases while the price decreases or stays the same, the price may start to rise.
In the case of divergence, the Money Flow Index is one of the most important tools to have. When the oscillator goes in the opposite direction of the price, this is known as a divergence. This seems to indicate that the current price trend may be reversing.
Unlike traditional oscillators, such as the Relative Strength Index (RSI), the Money Flow Index takes into account both price and volume data. For this reason, the MFI is sometimes referred to by analysts as the volume-weighted RSI.
Its therefore necessary for the trader to consider further technical analysis provided by other tools compatible with the Money Flow Index (such as graphic indicators, like Bollinger Bands or MACD) to confirm the entry point into the market.