
Momentum
The momentum indicator is a technical analysis tool used to identify ongoing trends and their remaining strength. It graphically represents the strength of a trend based on the relationship between the current price of a security and past prices.
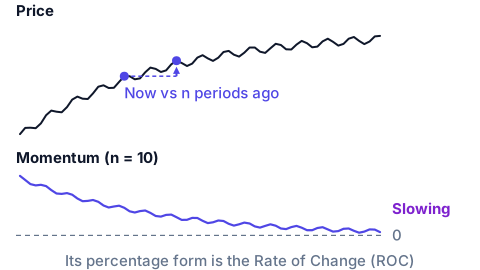
It does not provide specific directional indications, so its value can indicate either a buy or sell signal; it merely estimates the probability that the current trend will continue. Generally, it is not used to generate primary trading signals, but to confirm signals produced by other indicators or chart movements.
This card describes momentum as an idea. The operational measure built on it, and the one this platform computes, is the percentage form: the current price compared with the price of a set number of periods back, expressed as a percentage. It has its own card, Rate of Change (ROC), where the formula and the way to read it are set out in full. Reading momentum here and the number there is the same exercise seen twice, once as a concept and once as a figure.