
Merrill Lynch Option Volatility Estimate
Initially developed by Merrill Lynch, the MOVE index serves as the bond market's equivalent of the VIX. The MOVE index measures volatility in options traded on US Treasury Bonds, acting as a risk barometer to understand the sentiment shifts of participants in the US bond market. Specifically, the MOVE index tracks the movement of implied volatility of 2, 5, 10, and 30-year US Treasury yields from 1-month option prices.
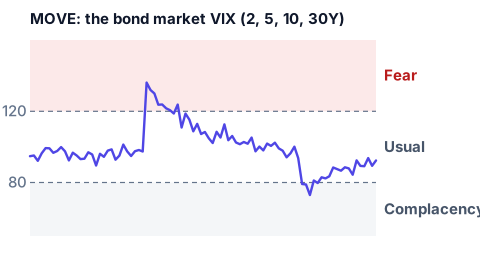
Harley Bassman, who created the index in the 1990s while working for Merrill Lynch, states that one can think of MOVE as the bond VIX. he MOVE possesses the unique ability to signal changes in risk sentiment within the fixed income market. Unlike the VIX, the MOVE can increase even when the underlying assets (in this case, Treasuries) move in either direction. The VIX typically rises when the S&P 500 index experiences a crash or is trending downwards. While not an infallible predictive indicator, it is rare for a low MOVE and a flat yield curve not to be swiftly followed by market volatility.
The MOVE Index tends to fluctuate between 80 and 120, with 80 representing extreme complacency and 120 indicating extreme fear. Movements to these extremes are quite uncommon. Readings below 80 have preceded the 1991 recession, the dot-com bubble, and the recent credit crisis. A reading below 80 tends to foreshadow a market problem or anomaly. Since implied volatility represents the cost of insurance, the MOVE measures investors' willingness to purchase risk insurance. A lower index value indicates less demand for risk protection. Furthermore, the MOVE can remain at a low level for an extended period before a market event occurs.
To gain insight into the sentiment of equity and bond markets, large investors often monitor the ratio between MOVE and VIX. MOVE/VIX Ratio is a Barometer for Asset Classes: When the VIX is increasing while the MOVE remains at very low levels, the MOVE/VIX ratio will be very low. Conversely, it's also possible for the MOVE to increase while the VIX remains low. The latter scenario is quite unusual but not entirely rare. The dynamic of the ratio between these two volatility indices therefore provides a barometer for potential outflows from one asset class to another: a low ratio would favor fixed income, while a high ratio would presumably favor equities.