
Moving Averages (MA)
It is an average of a certain amount of data that only considers the latest data in chronological order. This tool is, in fact, defined as "moving" because the number of elements considered (usually closing prices) is fixed, but the time interval advances. Old data must be removed when new data is added: this causes the average to move progressively with the price trend of the security being calculated. A 200-day moving average, for example, takes into consideration the values of the last 200 sessions and is recalculated every day, adding the latest data and excluding the most remote from the calculation, so that only 200 prices are always considered.
The use of the MA indicator consists in considering the results as real dynamic resistances/supports and making decisions when prices break them.
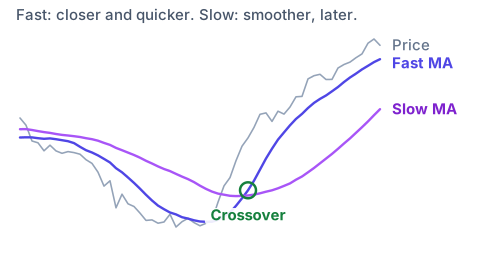
It should be noted that the period used significantly affects the indications generated: if you choose a smaller domain, you will obtain a moving average that is much closer to the prices, which will result in greater timeliness, but a greater number of false signals; on the contrary, a larger period will give rise to a smoother line that will provide more reliable suggestions, but with a greater delay compared to the other.
The problem is partially overcome by using a combination of two averages, a slow one and a fast one. This system is the most used by analysts. The operational signals are provided at the intersection of the two averages: when the faster one, i.e. generated by a smaller period, crosses the slower one upwards, a purchase suggestion will be generated; vice versa, when the slow one is cut downwards by the faster one, a sale will occur.
Simple Moving Average (SMA), also called arithmetic, is the most used due to its easier construction. The data of a certain period are taken and the average is calculated by adding them together and dividing by the total number of values.
The greater simplicity of calculation is paid with a major flaw: this algorithm assigns the same importance to each single input; the last value (perhaps even very distant in time) has the same importance as the first.
Exponential Moving Average (EMA): an indicator that is almost impossible to generate if not through appropriate calculation software.
This average is constructed by taking into account all the elements of the series but with an exponentially decreasing weighting.
The weighting of the first data of the series will be smaller as time passes until it becomes infinitesimal, but it will always be included in the calculation. In essence, the entire history of the title is taken into account.