
Normalized Average True Range (NATR)
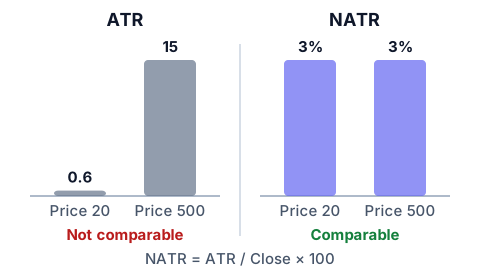
The ATR measures the volatility of a market in a specific period. It considers price gaps that can form between one day and the next. NATR can be more useful than the ATR when comparing different price levels. NATR adapts the Average True Range (ATR), allowing for comparisons across different securities and price points. It does this by calculating the ATR as a percentage of the closing price.
Formula: NATR = (ATR(period) / Close) * 100
Main uses are two. First, volatility-based reversal signals: use the NATR to identify potential reversals by monitoring significant differences in volatility. Second, trend confirmation: use directional changes in the NATR to confirm the strength of prevailing market trends.
The reason this normalization is needed is set out in full on the Average True Range (ATR) card: the ATR is an absolute figure, expressed in the currency of the security, so a higher priced security naturally shows a higher ATR and two securities cannot be compared on it directly. Dividing by the closing price removes the price level from the number and leaves a percentage, which is comparable. The same reasoning is why the Percentage Price Oscillator exists alongside the MACD: an absolute indicator becomes comparable only once the price level is divided out.