
Pivot Points
Pivot points are useful indicators for identifying potential intraday support and resistance areas, valid for the next session.
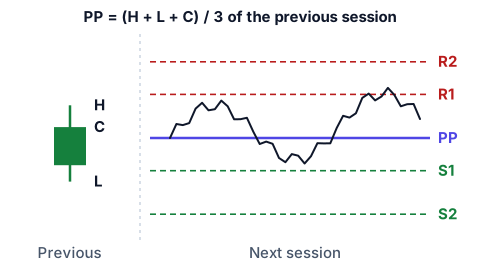
The interpretation is simple: prices above the PP (Pivot Point) indicate a bullish orientation; prices below indicate a bearish inclination. The support and resistance lines allow identification of defined areas where traders can gain from price action.
This means that the lines can provide entry and exit points for a trade. Pivot Points are objective, because they come from a fixed formula applied to the high, the low and the close of the previous period, so every trader using the same formula reads the same levels. That shared reference is part of the reason why price often reacts around them, but they remain a projection of past data: they describe where reactions are plausible, not where price will go, and they are normally combined with other tools before taking a position.