
Percentage Price Oscillator (PPO)
The PPO is one of the most widely used trading indicators, considered by many experts to be the evolution of the MACD. It measures the percentage difference between two exponential moving averages, short-term and long-term, and is useful for identifying changes in price momentum.
When the oscillator is above the zero line, it indicates that the short-term moving average is above the long-term one, suggesting a bullish moment. When it is below, it suggests a bearish moment.
Formula: PPO = (short-term EMA - long-term EMA) / long-term EMA
Interpretations: Trading signals: crossovers between PPO and signal line identify entry/exit points. Trend confirmation: positive PPO suggests bullish trend, negative PPO suggests bearish trend. Divergences: divergences between PPO and price can indicate trend reversals. Momentum evaluation: the amplitude of the oscillation indicates the strength of momentum.
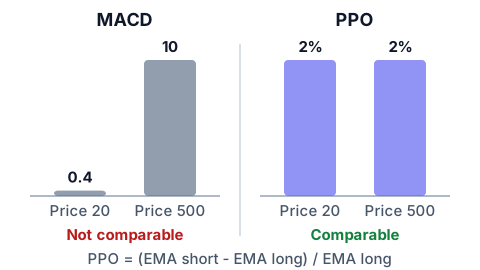
The percentage in the name is the whole point, and it is the same reasoning that separates the Normalized Average True Range from the ATR. The MACD is a difference between two moving averages, so it comes out in the currency of the security: on a security trading at 500 the same relative move produces a MACD many times larger than on one trading at 20, and the two numbers cannot be compared with each other or run through one shared threshold. Dividing by the long term moving average removes the price level and leaves a percentage, which travels between securities. The Average True Range (ATR) card states the underlying problem in full.