
Linear Regression
Linear Regression is a statistical technique used to model the relationship between a dependent variable and one or more independent variables. In financial markets, it is often used to analyze price trends and predict future movements based on historical data. By fitting a straight line (called the regression line) to price points, traders can identify the general direction of a trend and make informed decisions.
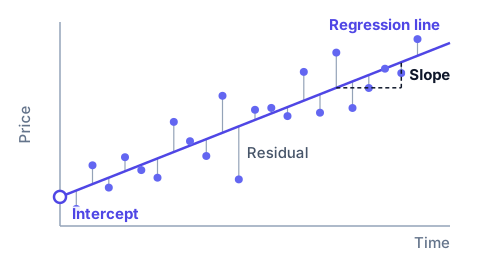
The linear regression indicator is based on the price trend of a security in a specific period. The trend is determined by calculating the line passing through the points according to the "least squares" method, which is the line that minimizes the sum of the squared distances between the line itself and the points determined in the observation period.
Linear Regression Intercept: represents the point where the regression line intersects the y-axis. In terms of trading, it indicates the predicted price of the asset when the independent variable (often time) equals zero. This value provides information about the overall direction of the trend.
Linear Regression Slope: represents the angle or steepness of the regression line. It measures the rate of change of the price over time, with positive values indicating an uptrend and negative values indicating a downtrend.
Linear Regression Angle: The indicator calculates the angle of the linear regression channel and displays it in a separate window in the form of a histogram. The signal line is a simple average of the angle.
The angle is the difference between the right and left edges of the regression (in points), divided by its period. A value greater than 0 indicates an uptrend, with higher values indicating stronger trends. A value less than 0 indicates a downtrend, with lower values indicating stronger downtrends.