
Relative Strength Index (RSI)
It is one of the most widely used technical analysis oscillator ever. The purpose of the RSI is to provide an indication of the strength of the trend.
RSI takes into account price data.
RSI is an oscillator and is a tool capable of revealing momentum and, through this, providing continuation, reversal, sell and buy signals.
This is the formula: RSI = 100 - [ 100 / ( 1 + RS )].
RS is the ratio between the average of the positive variations and the average of the negative variations recorded by the asset in a well-defined number of periods. Typically, the previous 14 periods are used.
The indicator produces a numerical value always inserted within a range that goes from 0 to 100.
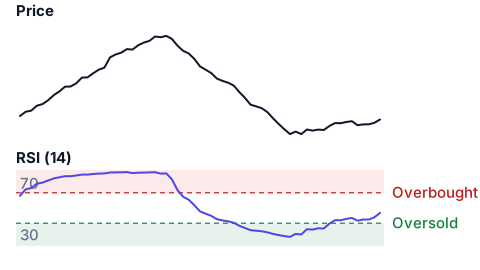
There are two criteria for reading the RSI: the first criterion consists in analyzing the RSI in a straightforward manner, that is, looking only at the value it expresses. This criterion allows you to draw "simple" oversold or overbought signals. The RSI sends sell signals when it expresses a value above 70-80, or suggests an overbought situation. This means that the market is close to its saturation and is preparing for a decline. The RSI sends buy signals when it expresses a value below 20-30, or suggests an oversold situation. This means that the market is "bottom out" and is almost ready to rise.
Both criteria share a limit that decides whether they work, and it is the reason a reading is never an instruction on its own: an extreme value says how far the move has already gone, not how much of it is left. In a strong trend the RSI can sit above 70, or below 30, for weeks while the price keeps going the same way, so selling the first reading above 70 means selling into strength. The same number can come before a reversal or before another leg of the same move, and what separates the two cases is the state of the market around it. A market that is going sideways pulls the price back towards its average, and there an extreme reading is often followed by a turn. A market that is trending keeps the oscillator saturated for as long as the trend lasts, and there the same reading is a sign of strength. Read the level together with the trend, never by itself.
The second criterion consists in analyzing the RSI in a perspective of comparison with the price line, that is, tracking down any incompatibilities between what you see on the screen and what the indicator reveals. This criterion allows you to identify, with reasonable advance notice, imminent trend reversals, and for this reason it is highly appreciated by those who practice Day Trading. To do this, it's necessary to find incompatibilities, or rather divergences, between price movements and the value expressed by the RSI itself: when the price is increasing but the RSI is in an overbought situation, the reversal is near, or at least it is likely that it will happen soon. On the other hand, when the price is decreasing but the RSI is in an oversold situation, the reversal could be just as near. The rationale for these correspondences is simple: in both cases, the RSI signals that the trend has reached its maximum strength, and cannot help but produce a rebound effect.