
Stochastic Oscillator
The Stochastic Oscillator is a momentum indicator that analyzes the strength and speed of an ongoing trend. It is based on the understanding of the strength of a trend depending on the closing point of the candles: if the close is close to the high, it indicates a strong bullish trend; if it is close to the low, it indicates a bearish trend.
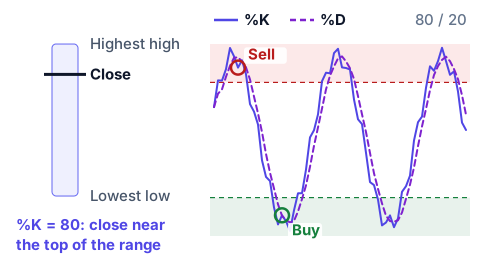
The oscillator is composed of two lines (%K and %D) that oscillate between 0 and 100. The %K Line (Fast Line) represents the percentage distance of the closing price from the average high/low. The %D Line (Slow Line) is the 3-period moving average of the Fast Line
The Stochastic works best in sideways markets without a defined trend, characterized by periods of accumulation that can last for a long time. Operational signals are generated when the two lines intersect in the overbought zone (sell signal) or oversold zone (buy signal).
Divergences, if identified near the extreme bands (0-20 and 80-100), can indicate the exhaustion of directional strength and a possible reversal.