
Technical Analysis
Technical analysis was born around 1900 from the studies of Charles Dow, creator of the Dow Jones index, through the study of graphs relating to historical series of prices and with particular mathematical-statistical methodologies. Dow was inspired by the continuous observation of the tidal movements from which he derived some general rules: waves increasing in size and power signal the arrival of high tide, while low tide is anticipated by a progressive weakening of the force of the waves. According to Dow, it is possible to predict market dynamics by studying their past.
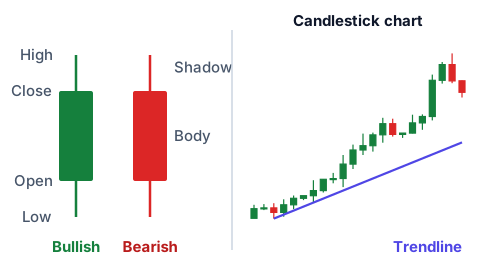
Technical analysis is carried out by studying graphs, indicators and oscillators:
graphs: lines that represent the trend of prices over time, capable of revealing any repetitive behavior patterns;
Indicators: allow you to summarize the relevant information on the trend of markets and financial securities:
Oscillators: are among the indicators that can be relevant in order to identify points of excessive rise or fall, or weakening of the dominant trend.
The most commonly used charts are the line chart and the candlestick chart:
line chart provides a quick way to visualize a long-term trend. A line chart represents where the price has been in the past and shows the closing price for a given period of time.
Candlestick charts use a visual representation of price that is divided into two main parts, the body and the shadow. These elements come together in an icon that resembles a candle, giving the chart style its name. The shadow, which appears as a thin line at the top and bottom of the body, shows the highest and lowest trading prices over a given period of time. The body of the candle, the thicker central part, shows the opening and closing prices during that time period.
Point and Figure (P&F) charts: a unique type of chart that focuses on price movements while filtering out time and minor price fluctuations. Unlike time-based charts, P&F charts use columns of X's (rising prices) and O's (falling prices) to represent significant price movements. Each X or O represents a specific price increment (box size). A new column begins only when the price reverses by a predetermined amount (reversal amount). This technique eliminates market "noise" and helps traders identify key support/resistance levels and breakout patterns more clearly. P&F charts are particularly useful for long-term trend analysis and determining price targets based on pattern measurements.