Volume Profile
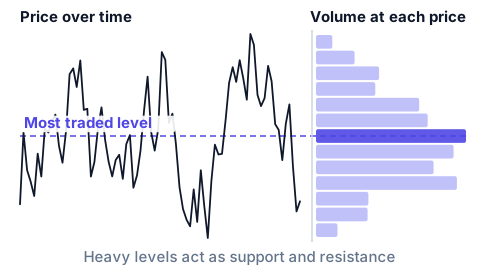
It is an analysis tool that shows the distribution of volumes traded at specific price levels over a given time period.
It is a visual approach that highlights the most significant price levels for the market, helping to identify areas of support and resistance and to understand liquidity.