
Volume Weighted Average Price (VWAP)
It represents the average price of a security, adjusted for trading volume, over a specific period. This metric offers insights into the price levels where the majority of trading has occurred. Typically, VWAP charts also display two standard deviations above and below the VWAP line, creating a band that helps identify price deviations and potential areas of overbought or oversold conditions.
Price is generally the closing or typical price (an average of High, Low, and Close). Volume is the trading volume for that period. The general formula for calculating VWAP is:
VWAP = ∑(Typical Price × Volume) / ∑Volume
Where Typical Price = (High + Low + Close) / 3.
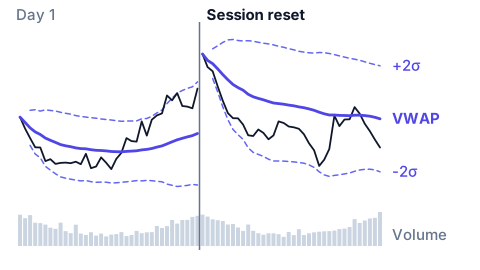
VWAP serves multiple purposes:
Execution Benchmark: Algorithms aim to execute large orders close to VWAP to minimize market impact. Trend Identification: Price above VWAP suggests bullish sentiment, while price below indicates bearish conditions. Entry/Exit Signals: Crossovers of price through VWAP can signal potential trend changes. Risk Management: VWAP bands help define stop-loss and take-profit levels
VWAP resets daily, making it particularly useful for intraday trading strategies. However, it can also be calculated over longer periods (weekly, monthly) for different analytical purposes.
Two details decide what the number on your screen actually is. The first is the window. The intraday version is cumulative: it starts from the first trade of the session and resets the next morning, so it weighs the whole day behind it. The rolling version instead keeps a fixed number of periods, 20 for example, and drops the oldest one as each new period arrives, so it never resets and it forgets old sessions on purpose. On the same chart the two draw different lines, and only the cumulative one answers the question an execution desk asks. The second detail is the band. Two standard deviations above and below the line are quoted almost everywhere, but the standard deviation can be measured on two different quantities: the typical price, or the volume weighted average itself. They are not the same number, because the second is already smoothed by the weighting and is therefore less dispersed. A band that looks too tight or too wide is usually this, not a change in the market.