
Zig Zag
The Zig Zag indicator is a technical analysis tool used to determine support and resistance levels. It connects some points of the chart with straight lines, creating a broken line that continuously changes inclination.
Analysts use it to reduce "noise" in charts, such as momentary breakouts and small retracements against the main trend, making charts more readable.
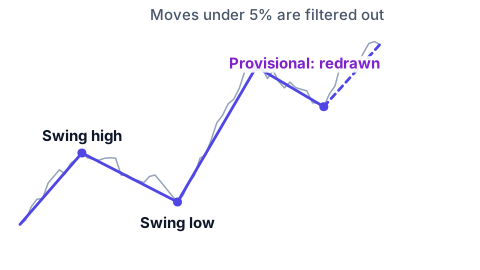
Although it does not directly generate trading signals, it can be used to identify important support and resistance points, from which signals can be derived when the price crosses a resistance upwards or a support downwards.
The Zig Zag is based on swing highs (highest points of a bullish trend) and swing lows (lowest points of a bearish trend), identifiable in this way:
Swing high: point where the price is higher than both the previous and the following period
Swing low: point where the price is lower than both the previous and the following period
That definition carries a consequence which is easy to read past. A swing high needs the following period to be lower, so it cannot be recognised at the moment it happens: it becomes visible only one period later, once the next bar exists. Until then the indicator holds a provisional line, and when a new extreme arrives that line is redrawn and the previous swing point disappears from the chart. What you see on a finished chart is therefore the shape the indicator settled on with hindsight, not the shape it was showing at the time. A backtest that buys and sells on Zig Zag points read off a completed chart is using information that did not exist when the trade would have been placed, and its results will look far better than anything reachable in real time.